Blockchain Explorer
Blockchain Explorer Overview
Jovay delivers a user-friendly, fully customizable blockchain explorer tailored for Layer 2 ecosystems, offering multi-dimensional visualization capabilities to enhance transparency and traceability.
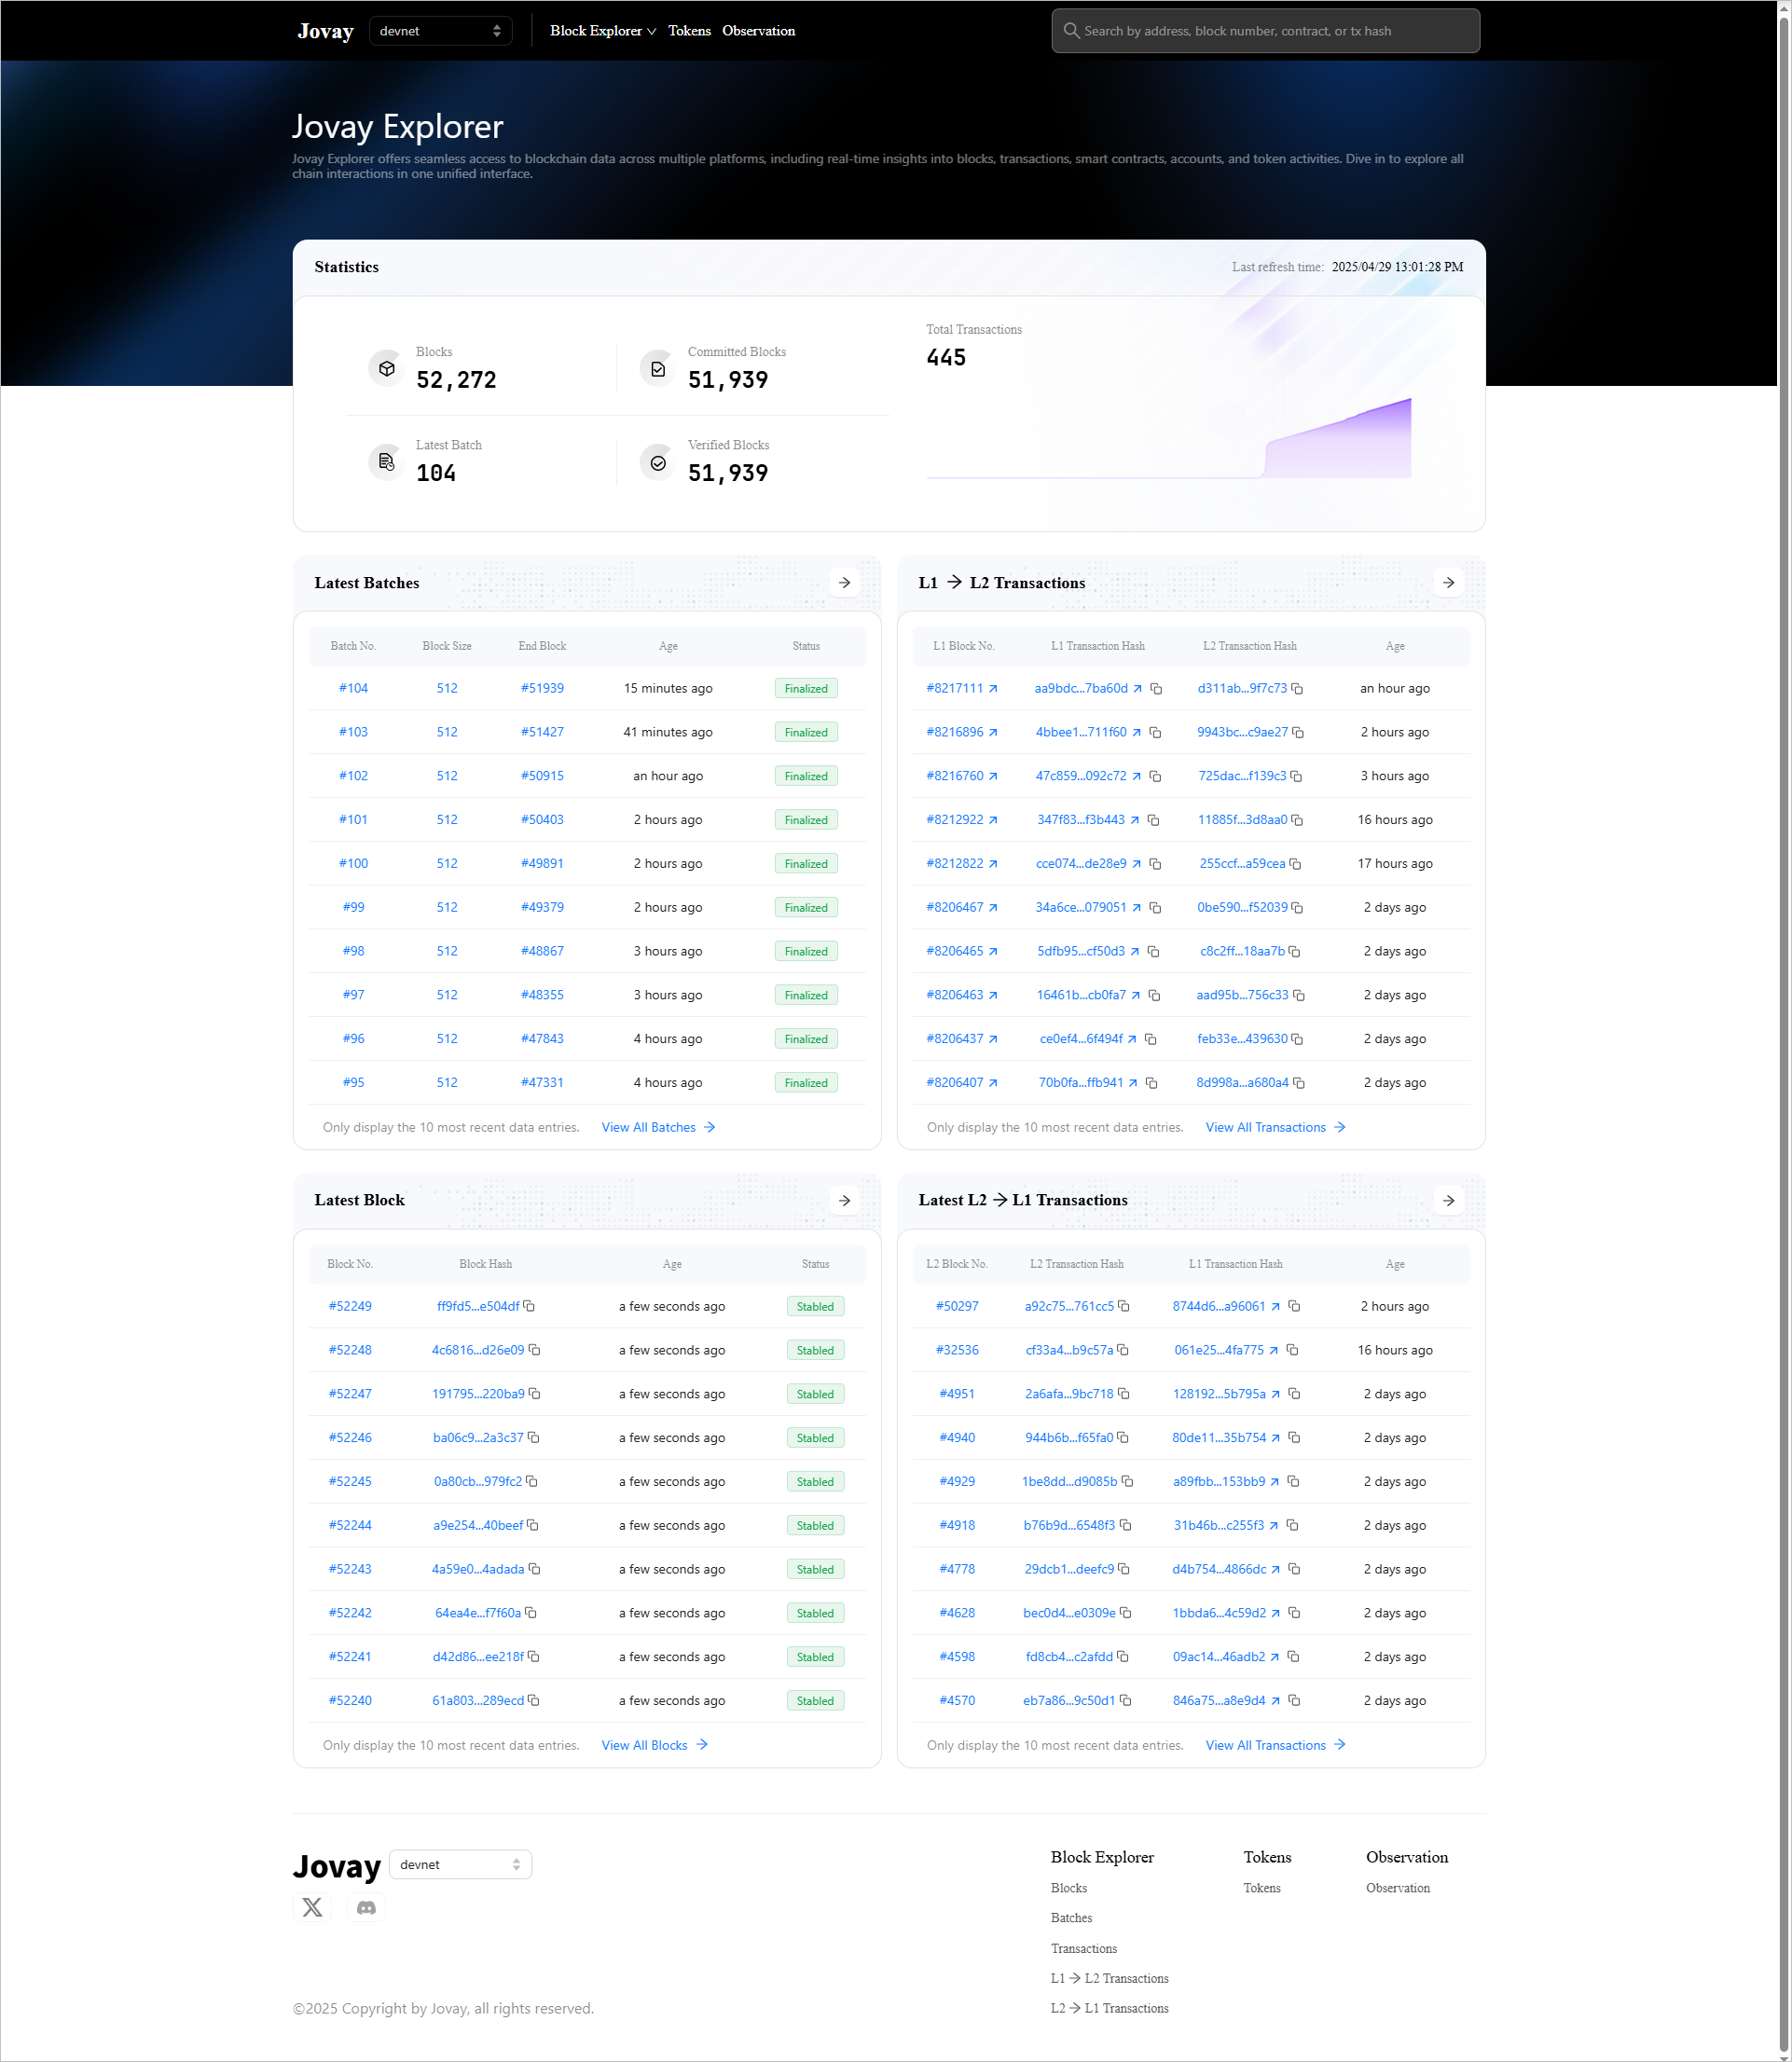
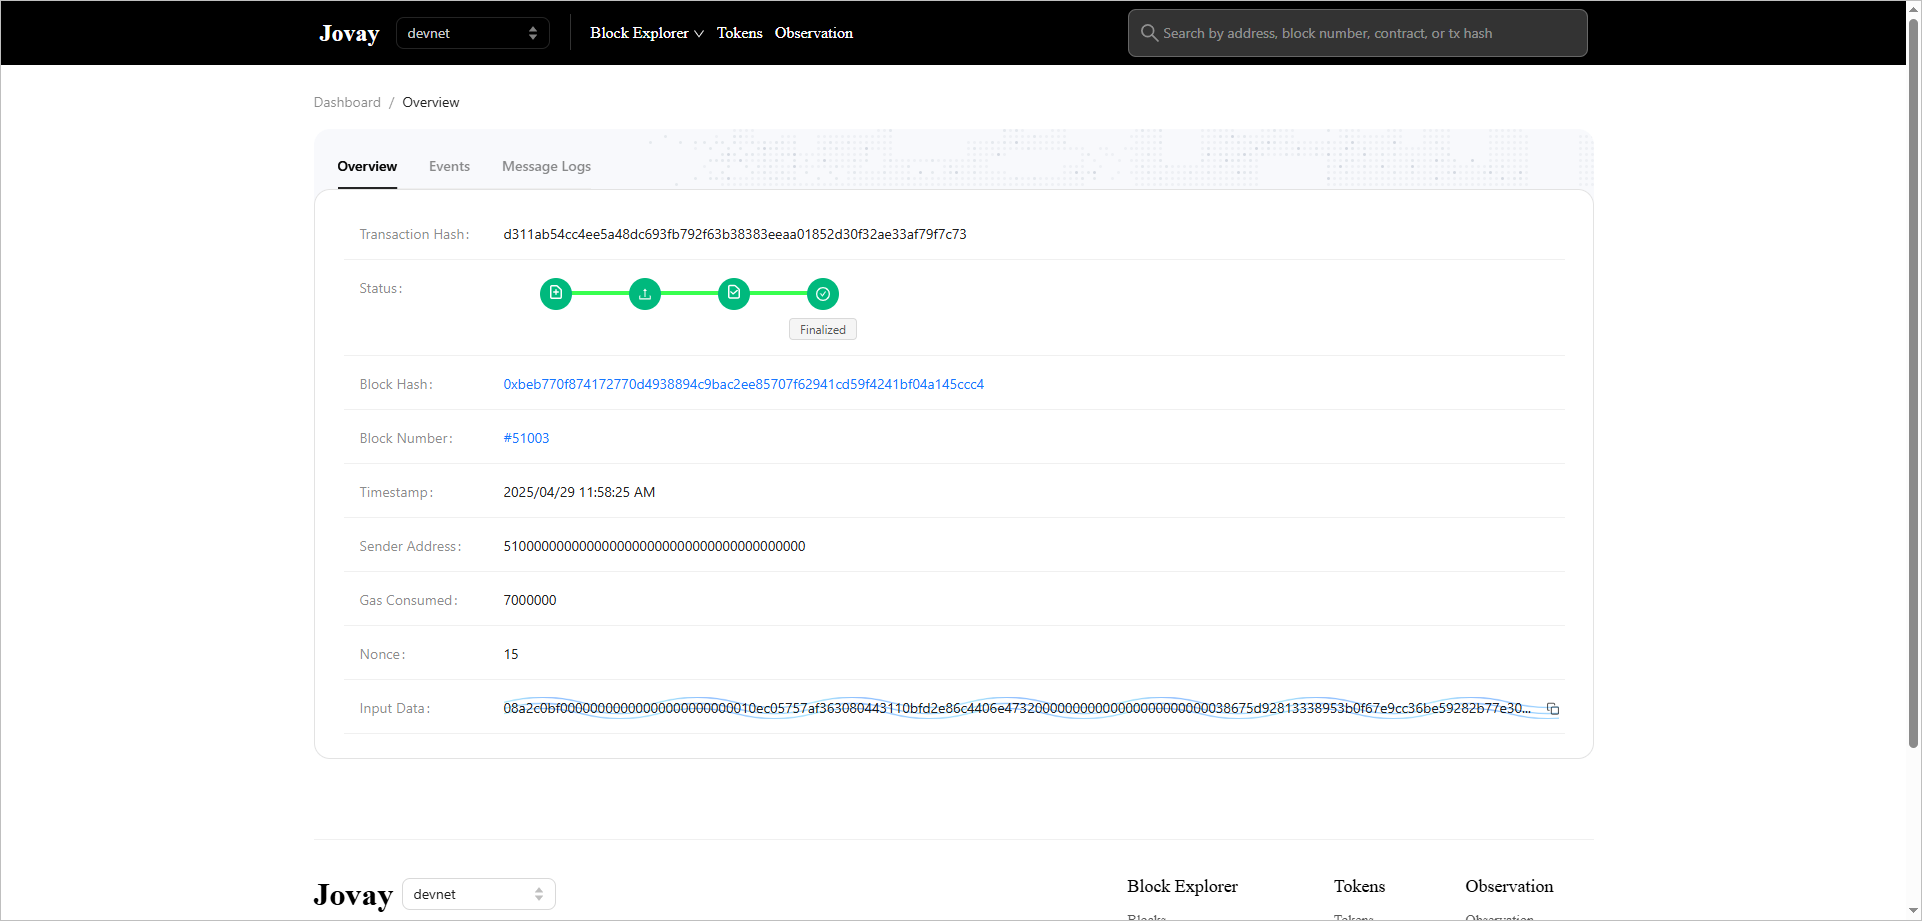
Figure 1: Blockchain Explorer Overview
Key Features
- Hierarchical Data Representation:
- Transaction verification data is systematically organized by batches, blocks, and transactions.
- Tracks the entire cross-layer proof lifecycle, including:
- L2 transaction execution stages
- L1↔L2 interoperability (deposits & withdrawals)
- Extensible Architecture:
- Modular frontend/backend design enables seamless adaptation to evolving Layer 2 network requirements.
- Supports plug-and-play functional expansions for customized visual analytics.
Observable System
Jovay observation system allows end users and developers to view transactions, prove system latency, and service call throughput in a visual way. The query capability supports observing and understanding the calling relationships and link duration of Layer2 system components, assisting developers in analyzing software performance and transaction behavior, and viewing the application and operation of the Layer2 network in a more three-dimensional way.
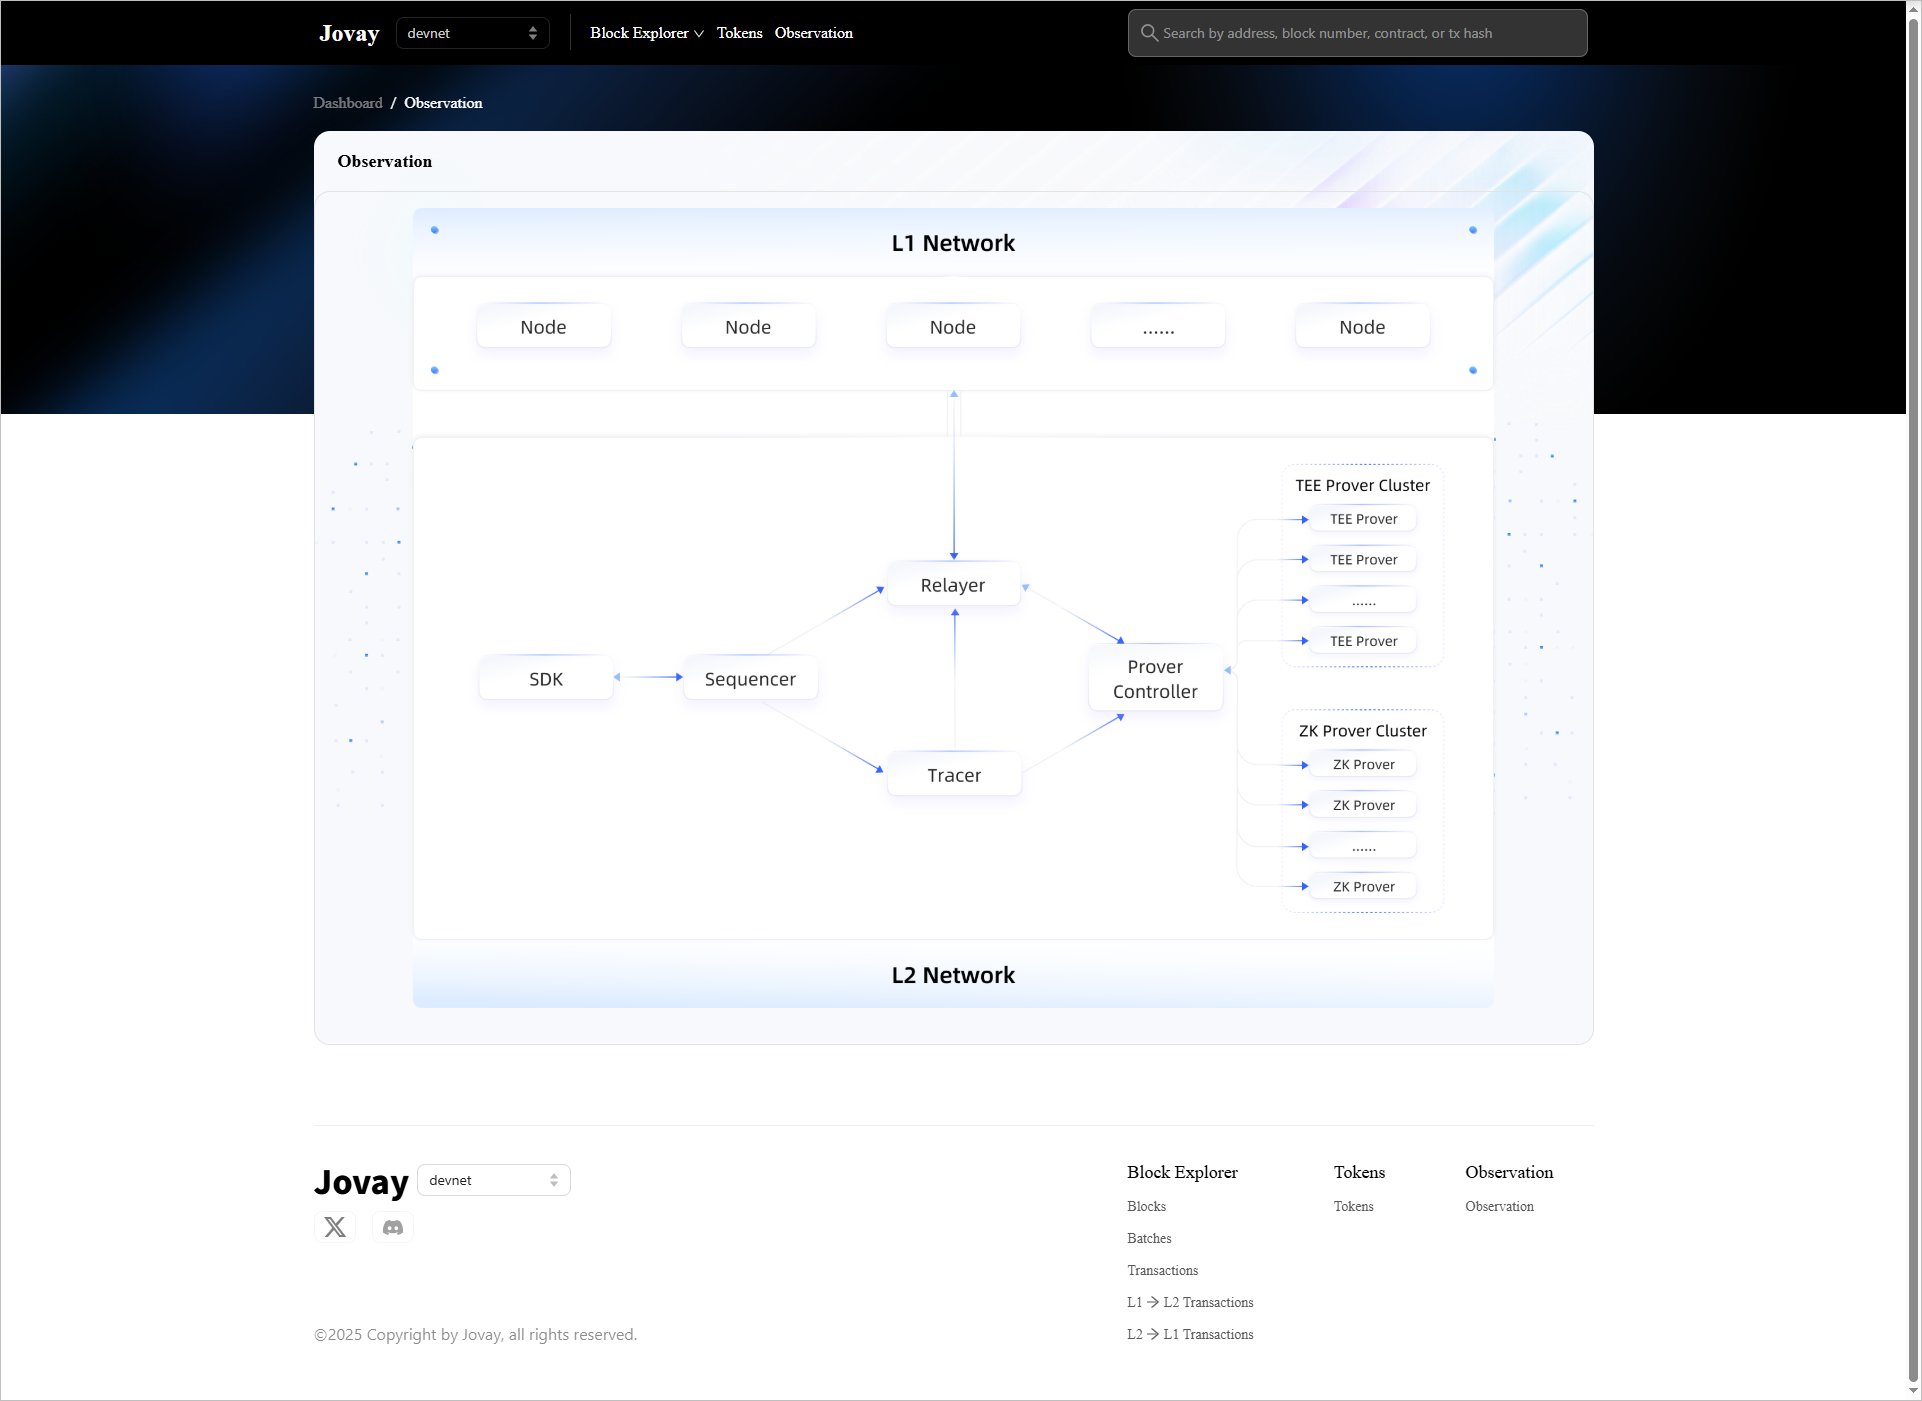
Figure 2: Observable System
Based on the link observation provided by the original Open Telemetry (OTEL), the observation system has expanded the capabilities of data statistics and link analysis, allowing end users to obtain observation information and statistical information through API/front-end UI and terminal programs through API.
- Easy integration: Provides Agent with rich development languages, allowing low-code application programs to insert piles and meta information tags at specific locations. Layer2 components identify specific stages of the transaction life cycle on Layer2 based on this feature.
- Link observation: The observation system collects link information reported by components based on the native OTEL collector and provides link query.
- Statistics dashboard: Based on link query, the observation system provides a statistical dashboard of call relationships, number statistics, and maximum/minimum/average call delays between components in the Layer2 system.
- Expanded link delay statistics: The observation system filters specific information based on the observation system based on customized meta information filtering components, and calculates statistical data. The current observation system is aimed at the TEE/ZK dual proof system, and can provide Layer2 proof generation delay and Layer1 confirmation delay query interface in the three dimensions of transaction/block/Batch; it provides the average time delay of Layer2 proof generation within a specific time range.
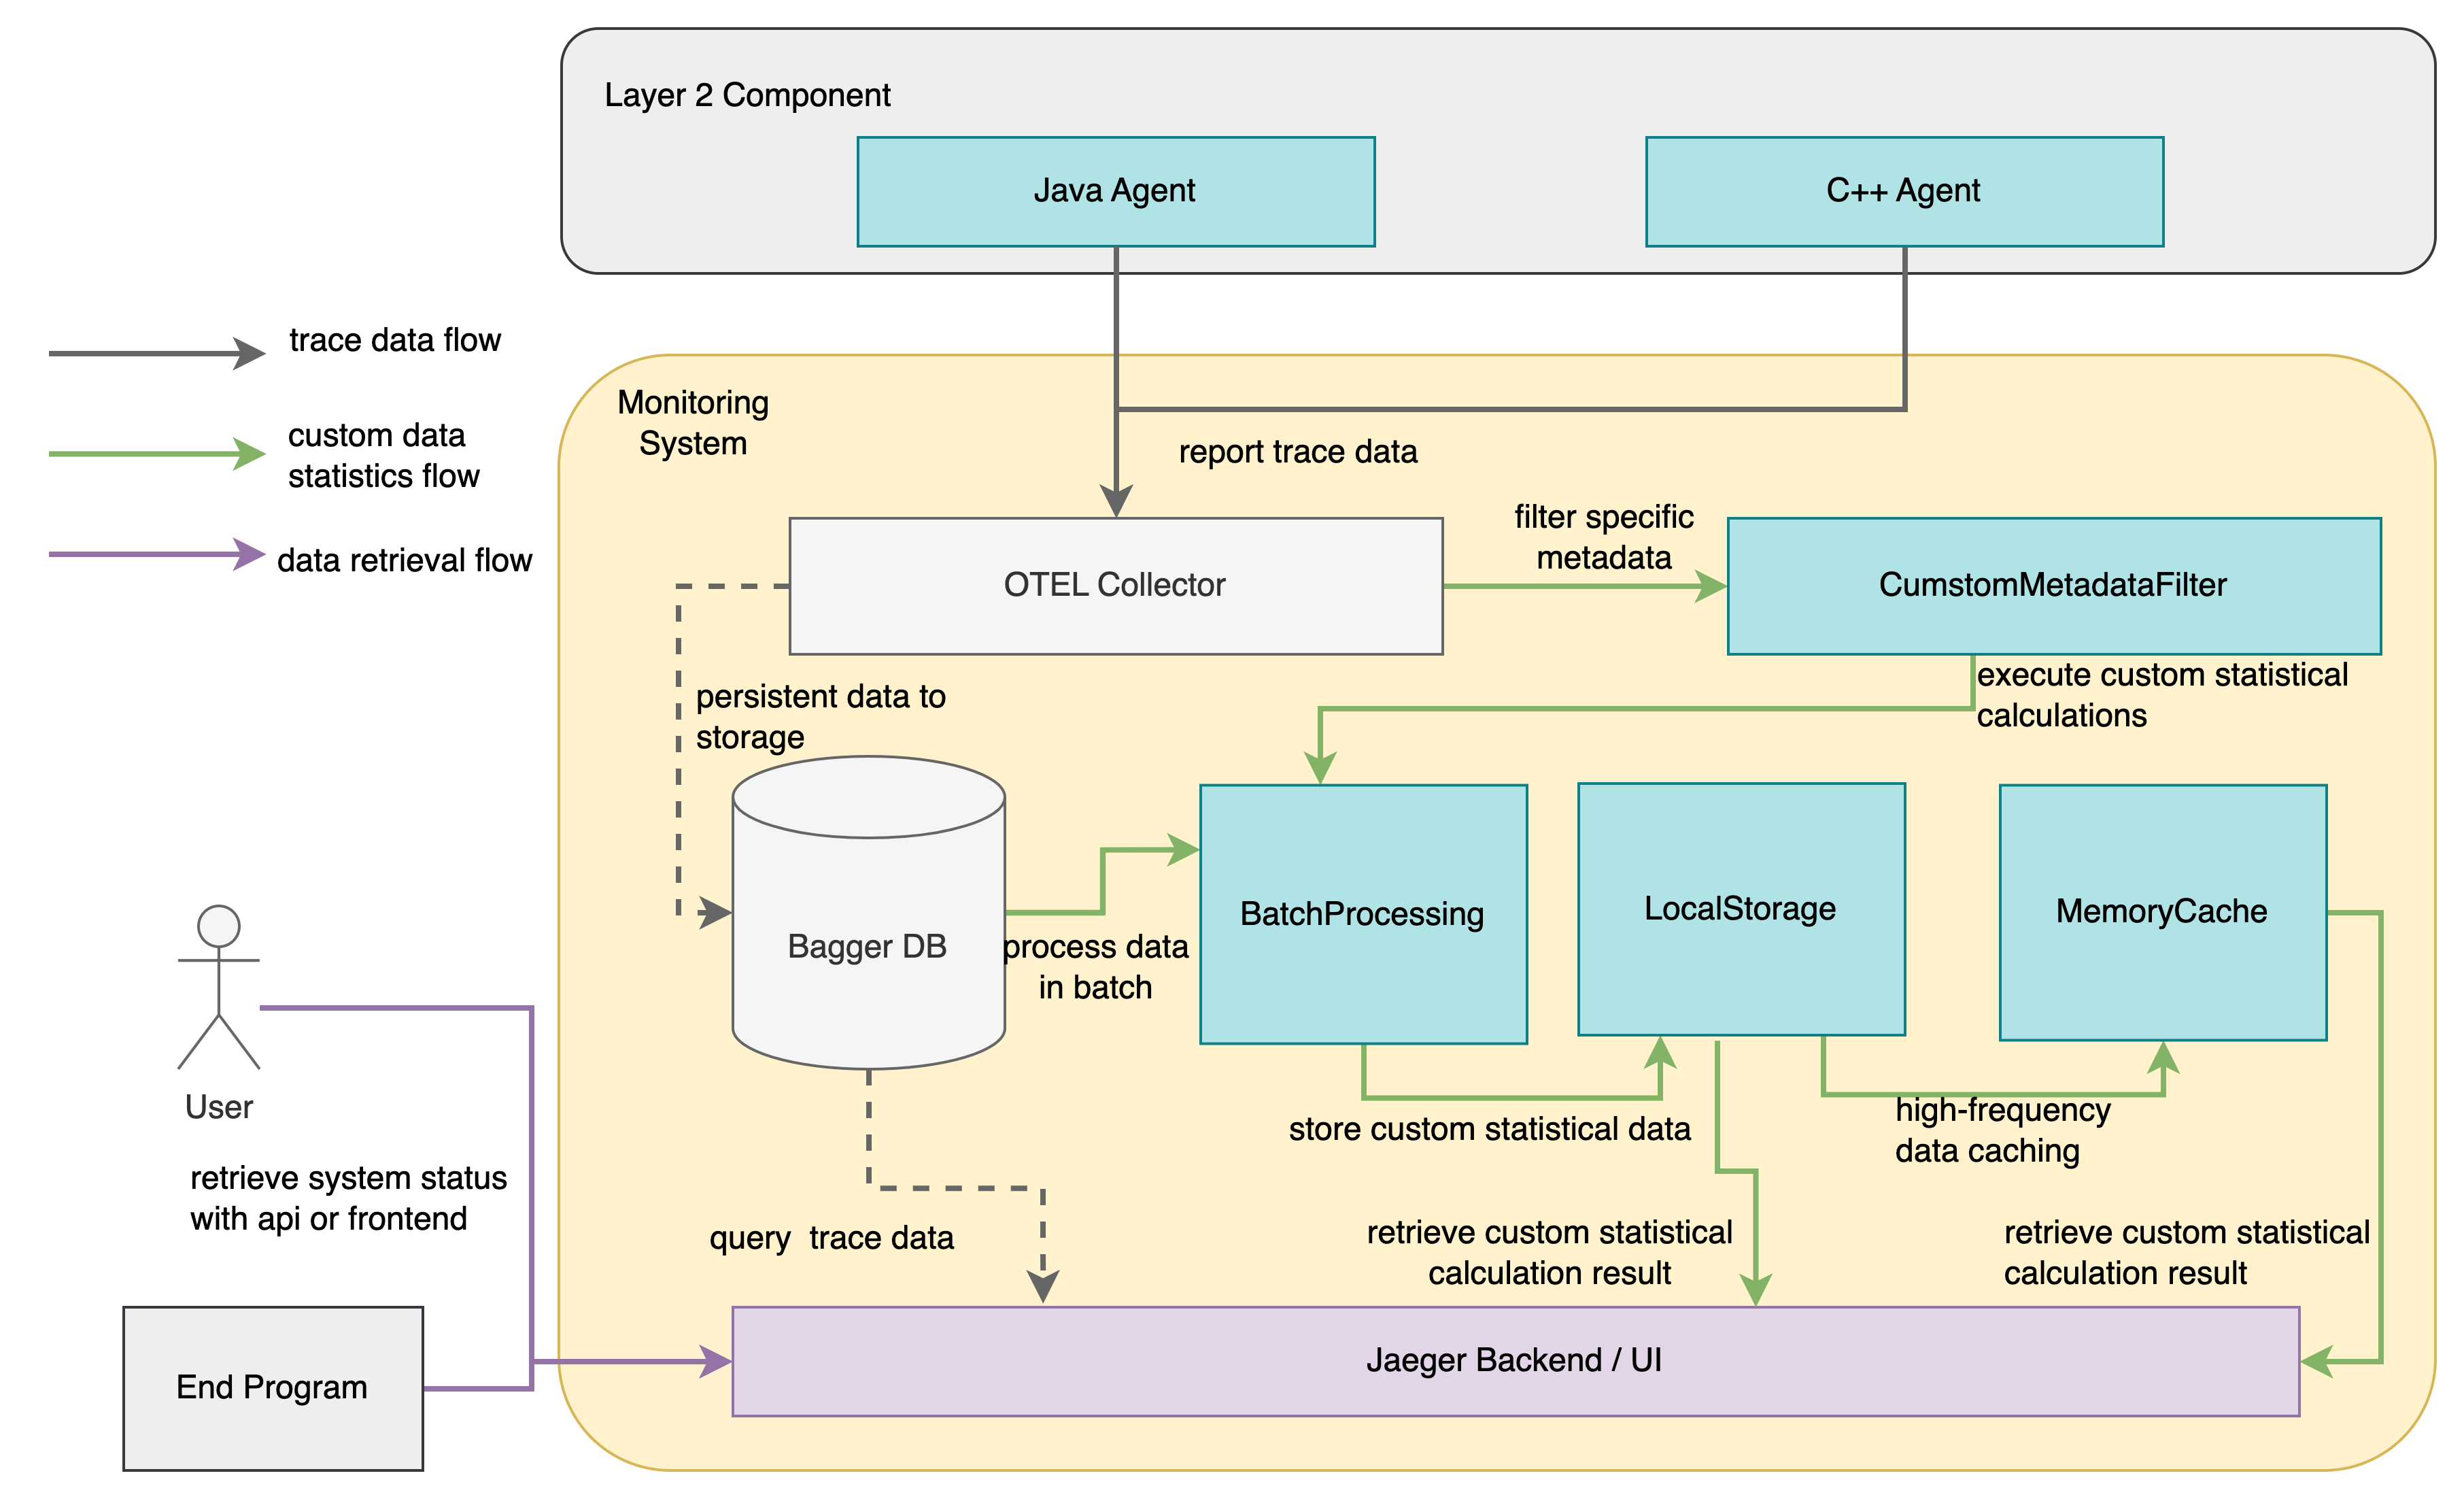
Figure 3: Observable System Architecture